Applies To
- Zenoss Resource Manager 5.x
- Zenoss Resource Manager 4.x
- OpenStackInfrastructure ZenPack
- OpenStack Ceilometer
Summary
This KB concerns troubleshooting OpenStack Ceilometer integration with Zenoss. It includes the following sections:
Background
Ceilometer is a component of OpenStack that is responsible for collecting metering and event information from the other components of OpenStack and publishing this information to systems that can consume it, such as Zenoss Resource Manager.
Architecturally, it uses a distributed architecture, where agents run on individual nodes within an OpenStack environment, and publish their information to the OpenStack AMQP bus, and then are processed and published to external systems and databases.
Ceilometer has two types of agents:
- Polling agents: use 'pollster' plugins that are invoked repeatedly to query data from the system, normalize it, and send it into ceilometer.
- Notification agents: consume existing notifications generated by OpenStack. This type of agent is more efficient, and is used when possible.
The data can be processed and transformed to normalize it. This, as well as the frequency with which the pollsters run, is controlled through the pipeline.yaml and event_pipeline.yaml files.
Zenoss provides a ceilometer_zenoss dispatcher plugin that must be loaded into the target OpenStack environment. It takes all collected ceilometer data and sends it across to a AMQP server within the zenoss environment. (Note: this is unrelated to the AMQP server that OpenStack uses internally.)
The overall data flow is as follows:
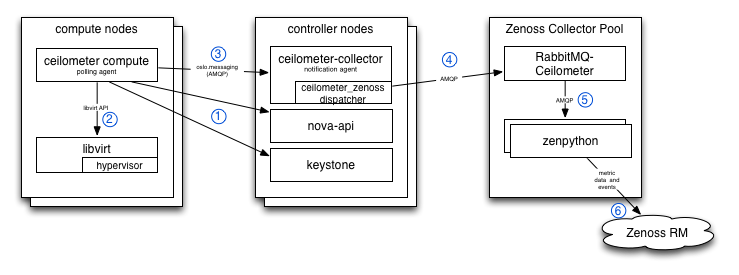
- Compute agent uses OpenStack APIs to get list of instances.
- Compute agent gathers detailed instance and vnic statistics from hypervisor via libvirt.
- Data is processed and dispatched via the oslo.messaging event bus.
- On controller nodes, these messages, along with event messages from other parts of OpenStack (instance state changes from nova, for instance) are received by ceilometer-collector and stored via any configured dispatchers.
- Zenoss dispatcher forwards all event and metric messages to zenoss's rabbitmq-ceilometer, a rabbitmq instance that runs in the collector pool.
- Zenpython, running on the zenoss collector, connects to rabbitmq-ceilometer and consumes these messages, forwarding any that are relevant to the zenoss system as any other datasource would.
Note: The process names may vary between versions of OpenStack. Traditionally, the ceilometer agent on the compute hosts has been named "ceilometer-compute". In the newton version, it is replaced by a "ceilometer-polling" process with a "compute" polling namespace. The ceilometer-collector process appears to be being gradually replaced with a different notification-type agent as well.
Troubleshooting Steps - OpenStack Side
If data does not seem to be flowing from OpenStack to zenoss, a systematic approach is best. Note that these steps are focused on performance data, rather than events. In general, if perf works, events will work as well. If anything, they are simpler, because while they use the same ceilometer_zenoss dispatcher plugin, the event processing is handled within a single process (ceilometer-collector).
Check ceilometer_zenoss dispatcher
First, check that ceilometer_zenoss is installed properly and able to send data to zenoss's rabbitmq-ceilometer. This is checked first because it is the most easily misconfigured.
On the control host where ceilometer-collector runs, check its log file (typically /var/log/ceilometer/collector.log)
Check for errors (none should be returned):
$ sudo grep ceilometer_zenoss /var/log/ceilometer/collector.log | egrep
'(WARNING|ERROR)'
Check for heartbeats:
Every 30 seconds, a message such as the following should appear:
2017-02-27 20:42:04.167 3279 INFO ceilometer_zenoss.dispatcher.zenoss [-] Sending heartbeat to zenoss.OpenStack.heartbeat.[device_id].[hostname].ceilometer-collector(where device_id is the id of the OpenStack device in zenoss, and hostname is the name of the host that ceilometer-collector runs upon)
(Optional) Check for metric and events data:
If your ceilometer-collector process is in debug mode, there will be a log message for every message that is sent to zenoss.
$ sudo grep ceilometer_zenoss /var/log/ceilometer/collector.log | grep
"Publishing message" | tail -25
On a normally functioning system, this should show the last 25 such messages, and should contain lines such as the following:
2017-02-27 20:57:04.517 3279 DEBUG ceilometer_zenoss.dispatcher.zenoss [-] Publishing message to zenoss.OpenStack.ostack.meter.image.size.a5256709-a3f9-4e3f-b911-75f6b6592ea5 record_metering_data /usr/lib/python2.7/site-packages/ceilometer_zenoss/dispatcher/zenoss.py:427
2017-02-27 20:57:04.960 3279 DEBUG ceilometer_zenoss.dispatcher.zenoss [-] Publishing message to zenoss.OpenStack.ostack.meter.image.a5256709-a3f9-4e3f-b911-75f6b6592ea5 record_metering_data /usr/lib/python2.7/site-packages/ceilometer_zenoss/dispatcher/zenoss.py:427
2017-02-27 20:57:05.091 3279 DEBUG ceilometer_zenoss.dispatcher.zenoss [-] Publishing message to zenoss.OpenStack.ostack.event.objectstore.http.request record_events /usr/lib/python2.7/site-packages/ceilometer_zenoss/dispatcher/zenoss.py:467
2017-02-27 20:57:05.092 3279 DEBUG ceilometer_zenoss.dispatcher.zenoss [-] Publishing message to zenoss.OpenStack.ostack.event.objectstore.http.request record_events /usr/lib/python2.7/site-packages/ceilometer_zenoss/dispatcher/zenoss.py:467
2017-02-27 20:57:05.094 3279 DEBUG ceilometer_zenoss.dispatcher.zenoss [-] Publishing message to zenoss.OpenStack.ostack.event.objectstore.http.request record_events /usr/lib/python2.7/site-packages/ceilometer_zenoss/dispatcher/zenoss.py:467
If there are no errors, but also no messages being published, the problem is within ceilometer. Full debugging of ceilometer issues is specific to the version of ceilometer installed, but in general, it would make sense to check the ceilometer-compute logs (typically /var/log/ceilometer/compute.log) on the compute nodes, as well as the ceilometer-collector logs (/var/log/ceilometer/collector.log) on controller nodes in the OpenStack environment.
Check ceilometer compute agent and collector
Check for pollsters being invoked by OpenStack-compute
In the compute.log, there should indications of pollsters being invoked periodically:
$ grep "Polling pollster" /var/log/ceilometer/compute.log | tail -5

2017-03-01 09:17:53.208 13621 INFO ceilometer.agent.manager [-] Polling pollster network.outgoing.bytes in the context of meter_source
2017-03-01 09:17:53.212 13621 INFO ceilometer.agent.manager [-] Polling pollster disk.device.read.requests in the context of meter_source
2017-03-01 09:17:53.218 13621 INFO ceilometer.agent.manager [-] Polling pollster network.outgoing.packets in the context of meter_source
2017-03-01 09:17:53.234 13621 INFO ceilometer.agent.manager [-] Polling pollster disk.read.requests in the context of meter_source
2017-03-01 09:17:53.239 13621 INFO ceilometer.agent.manager [-] Polling pollster network.incoming.bytes in the context of meter_source
Note that these pollsters will only run if at least one instance is running on this host.
Check for errors and warnings:
$ sudo grep ceilometer_zenoss /var/log/ceilometer/compute.log | egrep
'(WARNING|ERROR)'
If no errors are found, there may be a problem in the ceilometer pipeline yaml file(s). Reverting them to the defaults might be helpful. Ensure that the ceilometer.conf file is correct on both compute and controller nodes.
If errors are found they may point to the issue. In particular, verify the ceilometer.conf file:
-
oslo.messaging access is set up properly (typically, this is configured in the [oslo_messaging_rabbit] section, and includes the rabbitmq host and credentials used to communicate with the OpenStack AMQP service. This is necessary so that collected data can be published to a queue for processing by OpenStack-collector.
-
Authentication is configured correctly (auth_url, user, password, etc) - these are used for querying the OpenStack compute (nova) APIs.
- Verify the configuration settings documented in the zenpack installation instructions have are correct:
- [notification] store_events = True
- [DEFAULT] notify_on_state_change = vm_and_task_state
- Liberty: [oslo_messaging_notifications] notification_driver = messagingv2
Mitaka+: [oslo_messaging_notifications] driver = messagingv2
If these steps did not uncover any issues, and the data is still not being published to zenoss as described above, the problem must lie on the ceilometer side. Detailed debugging of ceilometer is beyond the scope of this document.
Troubleshooting Steps - Ceilometer RabbitMQ (Zenoss Side)
If messages seem to be being published to zenoss, but graphs and events are not populating, then it is necessary to look at Ceilometer-RabbitMQ and zenpython.
NOTE: Each message coming from ceilometer includes a routing key, which among other things, identifies the device ID in zenoss that that ceilometer corresponds to. It is critical that the device ID in zenoss match the zenoss_device value in ceilometer.conf. You should already have verified this by looking at the ceilometer_zenoss logs, but confirm it again, because an incorrect configuration of this parameter results in all data being dropped by rabbitmq.
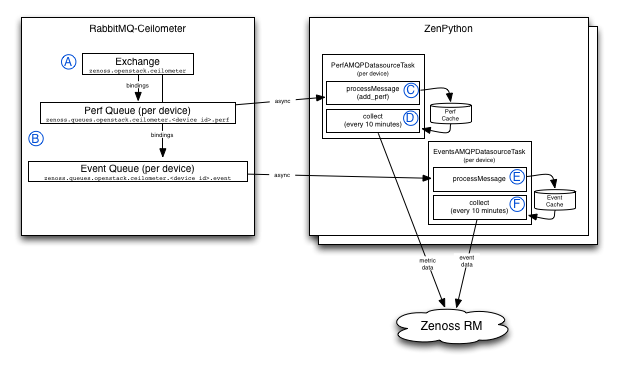
When messages enter the exchange (zenoss.OpenStack.ceilometer), the data flow is as follows:
- Messages are published from OpenStack (ceilometer_zenoss) to the zenoss.OpenStack.ceilometer exchange.
- RabbitMQ routes the message to a queue based on their routing key and the queue bindings. There are multiple queues per device, including one for perf data and one for event data.
- The first time the AMQP datasource runs inside zenpython, it creates a subscription to the perf queue for that device. Messages are immediately processed as they enter this queue, by the "processMessage" method in the datasource. This method then adds the data to a local cache within the zenpython process.
- Data is consumed from the cache every 10 minutes, when the datasource task executes (collect). Unused data (data that is published by ceilometer, but not used by any configured monitoring templates in zenoss) expires from the cache automatically.
- Event data is consumed in the same manner (from the event queue for the device being monitored, to a local cache).
- Each time the event task executes collect(), all cached event data for the device is sent to the zenoss event system.
Check Exchange
On Zenoss 5.x, the exchange (zenoss.OpenStack.ceilometer) is created automatically when the RabbitMQ-Ceilometer service is started.
On Zenoss 4.2, the user invokes the openstack_amqp_config script that creates this exchange on the regular Zenoss rabbitmq instance (there is no separate RabbitMQ-Ceilometer on Zenoss Resource Manager 4.2).
To confirm that the exchange is present, attach to the rabbitmq-ceilometer container and issue the following command:
$ sudo rabbitmqctl -p /zenoss list_exchanges | grep OpenStackThe correct output is:
zenoss.openstack.ceilometer topic
zenoss.openstack.heartbeats topic
Check Queues
To confirm that the messages are reaching the queues (which they should, if the exchanges are correct and the messages are being shown as published in the ceilometer_zenoss log on the OpenStack side), attach to the rabbitmq-ceilometer container and issue the following command:
$ sudo rabbitmqctl -p /zenoss list_queues | grep OpenStack

zenoss.queues.OpenStack.ceilometer.ostack.event 0
zenoss.queues.OpenStack.ceilometer.ostack.perf 0
Because messages are being consumed constantly by zenpython (C and E in the diagram above), stop zenpython, and wait a few minutes, preferably while watching the ceilometer logs. These counts should go up one for every message published by ceilometer_zenoss:
$ sudo rabbitmqctl -p /zenoss list_queues | grep OpenStack

zenoss.queues.OpenStack.ceilometer.ostack.event 3
zenoss.queues.OpenStack.ceilometer.ostack.perf 15
Then, restart zenpython, and they should drop again:
$ sudo rabbitmqctl -p /zenoss list_queues | grep OpenStack

zenoss.queues.OpenStack.ceilometer.ostack.event 0
zenoss.queues.OpenStack.ceilometer.ostack.perf 0
If this is true, the communication is confirmed to be working correctly and there are no rabbitmq issues.
Troubleshooting Steps - Zenpython AMQP Datasources
Check Collection
At this point, if you conducted the tests above, it is confirmed that rabbitmq is flowing messages from end to end correctly. At this point it is necessary to look at the collect() methods (D and F above). Place the zenpython process in debug mode, and watch for when the collect methods are invoked (every 10 minutes by default), and whether they produce any data.
Each time the collect methods is called, there will be a line matching "Collect for OpenStack AMQP", with the device ID. Assuming these are being called, and the device ID reflected matches the one seen in the rabbitmq queue names in the previous step, there is no specific problem indicated. If graphs are not populating, despite everything appearing to work properly, it may be necessary to look more closely at the specific data that zenoss is expecting to receive from Ceilometer, and verify that those messages are being sent. In particular, we expect the following performance metrics:
| monitoring template | datasource | data type | Ceilometer metric name |
|---|---|---|---|
| Instance | cpuUtilization | meter | cpu_util |
| Instance | diskReadBytesRate | meter | disk.read.bytes.rate |
| Instance | diskReadRequestsRate | meter | disk.read.requests.rate |
| Instance | diskWriteBytesRate | meter | disk.write.bytes.rate |
| Instance | diskWriteRequestsRate | meter | disk.write.requests.rate |
| Vnic | networkIncomingBytesRate | meter | network.incoming.bytes.rate |
| Vnic | networkIncomingPacketsRate | meter | network.incoming.packets.rate |
| Vnic | networkOutgoingBytesRate | meter | network.outgoing.bytes.rate |
| Vnic | networkOutgoingPacketsRate | meter | network.outgoing.packets.rate |
Comments